With the statistics Appliance, you can monitor in real-time all events of your proxy farm.
This feature is only available if your Proxy servers using the “Send events by syslog” feature.
- On the top menu, click on “Events“
- The first tab display events sent by your remote proxies
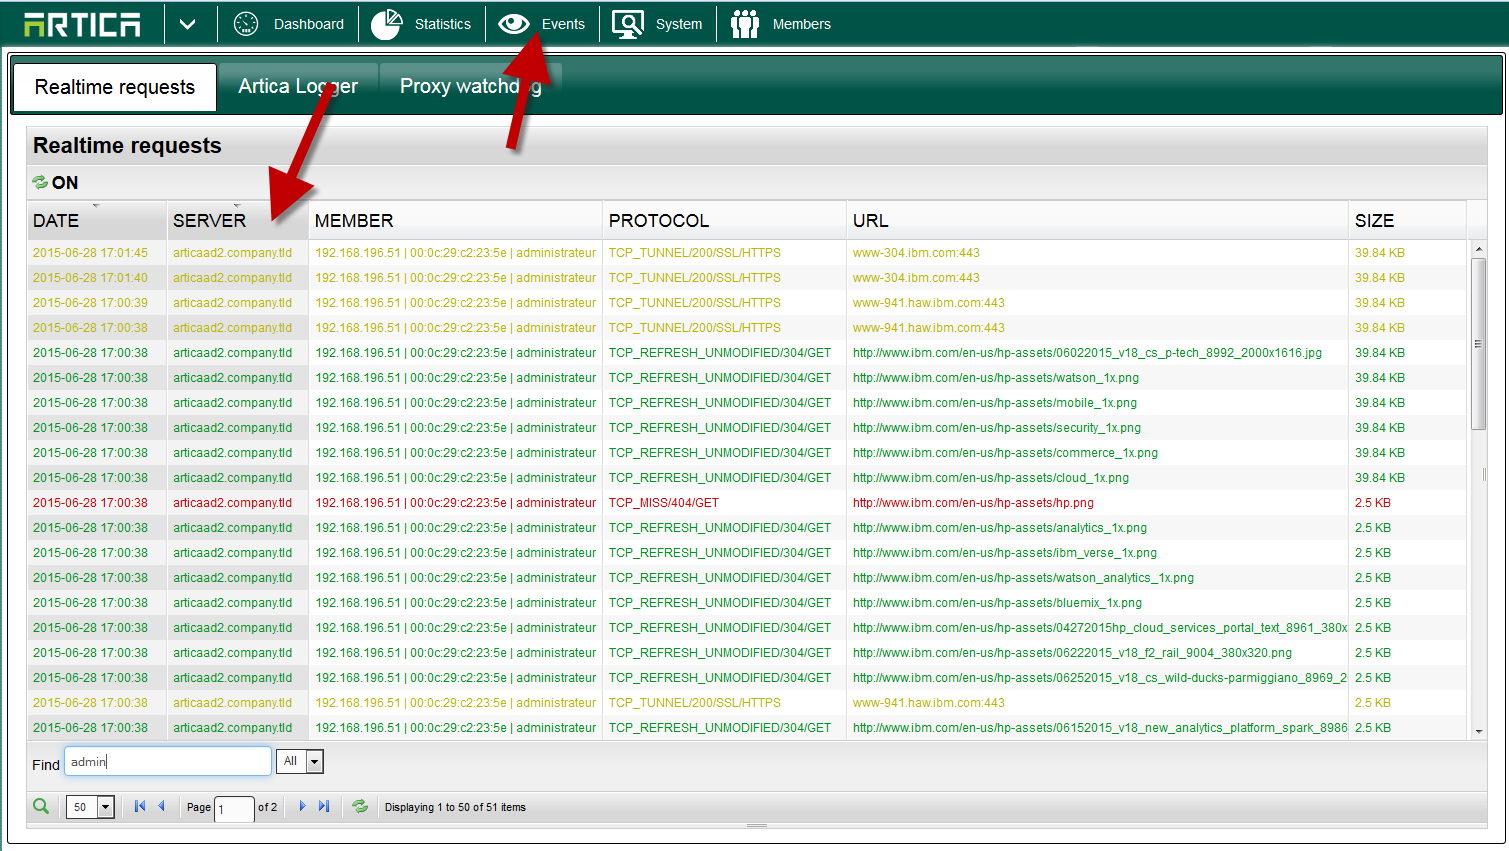
The monitor display events in different colors.
- Green: Request was cached ( bandwidth is saved )
- Yellow: Request is an SSL request.
- Red: Issue on the request
- Black: Request is processed but no cache.